
Agentic Equity Analyst,designed for .

To be the trusted AI partner for the
world's leading financial institutions.

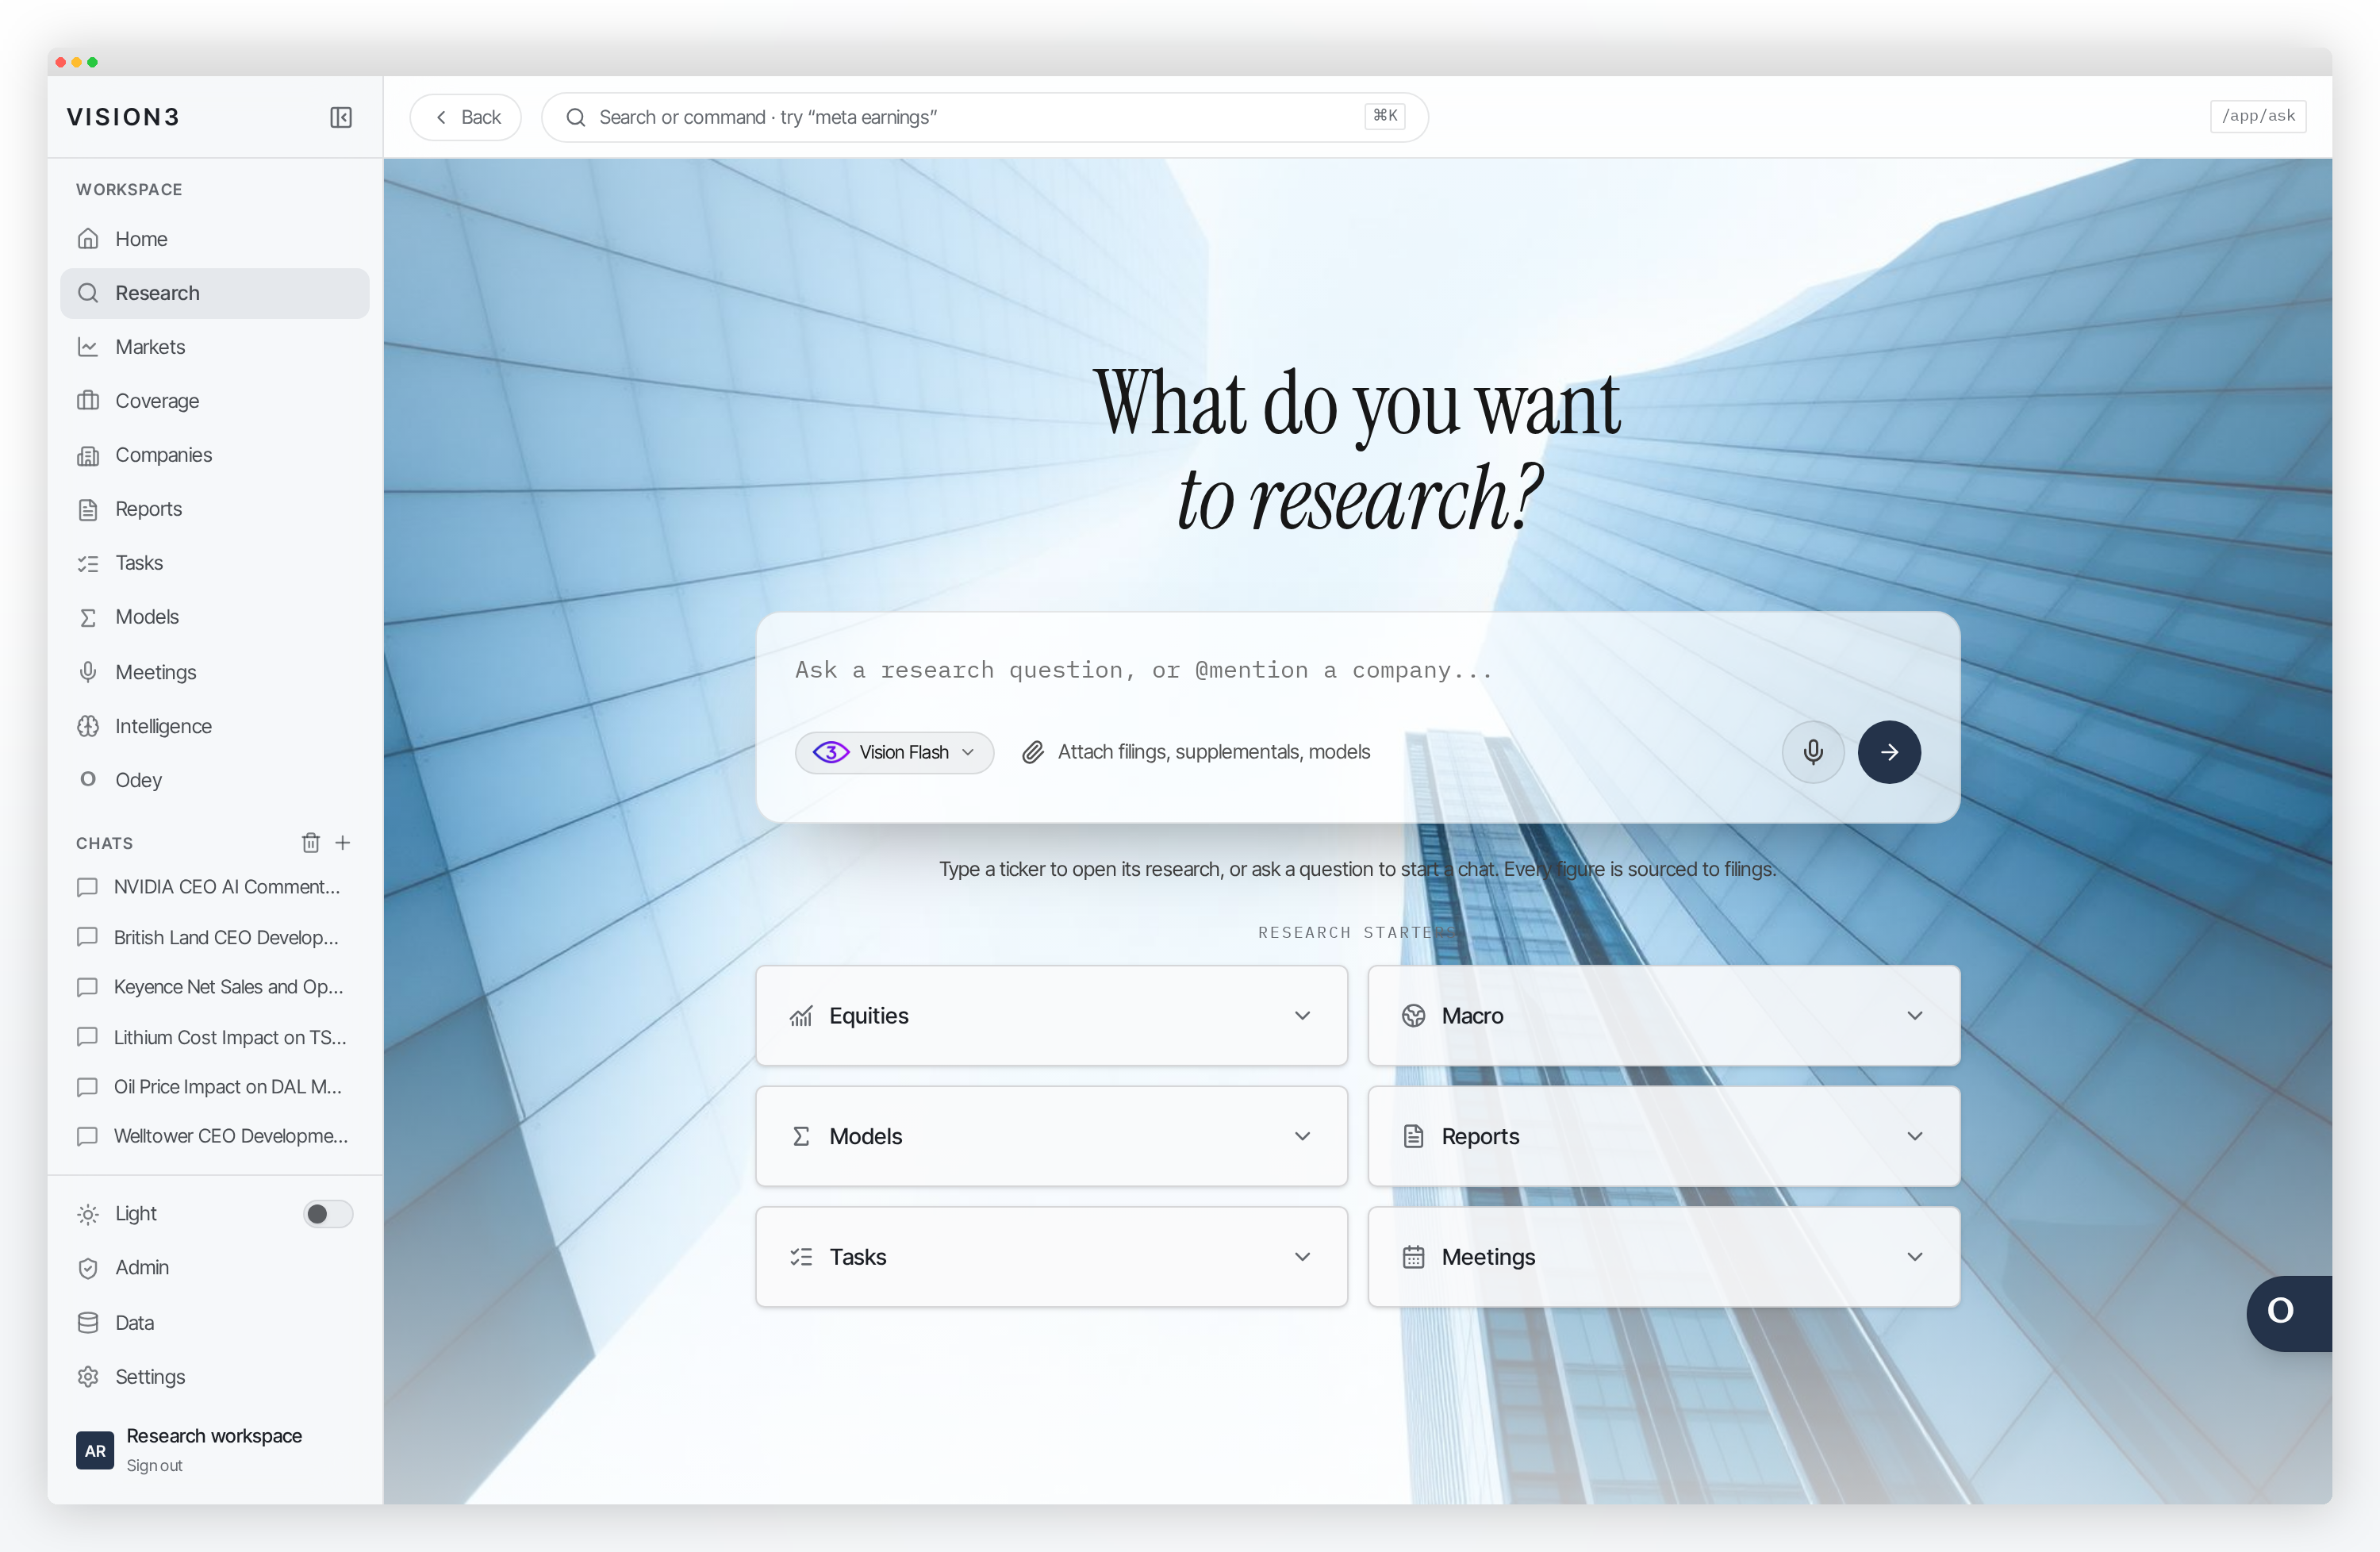
Attach filings, supplementals, models
Sources
  • European Commission
  • Prologis
  • Welltower
  • Digital Realty
  • Equinix
  • Omega Healthcare Investors
  • Simon Property Group
  • Klépierre

Built for financial work that has to be right.

Sourced

Material financial observations link back to their underlying disclosures.

Reconciled

Models use explicit accounting relationships and validation checks rather than relying solely on generated text.

Transparent

Users can inspect assumptions, formulas, model changes and source provenance.
Safe, private, and yours.

ISO/IEC 42001:2023
SOC 2 Type II
Encrypted end-to-end
No training on user data
CCPA
GDPR
London skyline at dusk

Financial analysis becomes difficult at the point where generic frameworks stop working.

A healthcare REIT is not an industrial REIT. A bank is not an infrastructure company. A data centre operator cannot be modelled like a conventional property company.

The accounting varies, the metrics change alongside the operating drivers. Let alone valuation frameworks.

VISION3 is designed around those differences.

From disclosure
to decision.

A structured workflow that connects primary sources to models, insights and action.

Explore the workflow

01

Primary sources

Annual reports, interim results, SEC filings, supplementals, presentations, trading updates.

02

Structured company intelligence

Financials, operating KPIs, portfolio, debt, development, historical observations.

03

Company model

Operating model, earnings, NAV, DCF, scenario analysis, validation checks.

04

Investment intelligence

What changed? Why does it matter? What changed in the model? What changed in the valuation? What changed in the thesis?

Global coverage

Tokyo. London.
New York. Everywhere.

VISION3 works across jurisdictions, accounting standards and languages, navigating issuer sites, regulatory filings and primary disclosures to deliver clear, cited investment research.

Explore the platform
50+
Exchanges
100,000+
Companies
Multiple
Accounting standards
One
Evidence spine

Research that keeps working.

VISION3 maintains a structured understanding of each company across filings, models, assumptions and research.

When new information arrives, VISION3 can identify material changes, update the relevant analytical workflow and surface what requires investor attention.

Human judgement remains in control.

Event→Read→Extract→Reconcile→Model→Valuation→Thesis→Review

Models you can interrogate.

VISION3 connects operating assumptions, financial statements and valuation through transparent model relationships. Change an assumption. See the consequences. Understand the dependency. Trace the source.

A
B
C
D
E
F
G
H
I
J
K
ASML Holding N.V. (ASML.AS) · Base case · EUR millions unless stated
Historical FY2021A–FY2025A uses admitted issuer statements. Forecast FY2026E–FY2030E references Assumptions (Base column).
Income statement
Line item
FY2021A
FY2022A
FY2023A
FY2024A
FY2025A
FY2026E
FY2027E
FY2028E
FY2029E
FY2030E
6
Net system sales
13,652.8
15,430.3
21,938.6
21,768.7
24,474.3
34,179.0
45,083.8
55,450.3
63,461.8
66,783.0
7
Net service and field option sales
4,958.2
5,743.1
5,619.9
6,494.2
8,193.0
9,340.0
10,647.6
12,138.3
13,837.7
15,774.9
8
Total net sales
18,611.0
21,173.4
27,558.5
28,262.9
32,667.3
43,519.0
55,731.4
67,588.6
77,299.5
82,557.9
9
Revenue growth
13.8%
30.2%
2.6%
15.6%
33.2%
28.1%
21.3%
14.4%
6.8%
10
Cost of system sales
(6,482.9)
(7,582.3)
(10,151.0)
(10,406.9)
(11,384.0)
(14,228.1)
(18,046.4)
(21,158.0)
(17,518.1)
(14,537.1)
11
Cost of service and field option sales
(2,319.1)
(2,891.0)
(3,271.4)
(3,364.0)
(4,025.3)
(4,585.9)
(5,228.0)
(5,959.9)
(6,794.3)
(7,745.5)
12
Total cost of sales
(8,802.0)
(10,473.3)
(13,422.4)
(13,770.9)
(15,409.3)
(18,814.1)
(23,274.4)
(27,117.9)
(24,312.4)
(22,282.6)
13
Gross profit
9,809.0
10,700.1
14,136.1
14,492.0
17,258.0
24,704.9
32,457.1
40,470.8
52,987.1
60,275.3
14
Gross margin
52.7%
50.5%
51.3%
51.3%
52.8%
56.8%
58.2%
59.9%
68.5%
73.0%
15
Research and development (R&D) costs
(2,547.0)
(3,253.5)
(3,980.6)
(4,303.7)
(4,698.8)
(5,439.9)
(6,966.4)
(8,448.6)
(9,662.4)
(10,319.7)
16
R&D as % of sales
13.7%
15.4%
14.4%
15.2%
14.4%
12.5%
12.5%
12.5%
12.5%
12.5%
17
Selling, general and administrative (SG&A) costs
(725.6)
(945.9)
(1,113.2)
(1,165.7)
(1,257.8)
(1,610.2)
(2,062.1)
(2,500.8)
(2,860.1)
(3,054.6)
18
SG&A as % of sales
3.9%
4.5%
4.0%
4.1%
3.9%
3.7%
3.7%
3.7%
3.7%
3.7%
19
Other income
213.7
-
-
-
-
-
-
-
-
-
20
Income from operations
6,750.1
6,500.7
9,042.3
9,022.6
11,301.4
17,654.8
23,428.6
29,521.4
40,464.6
46,901.0
21
Operating margin
36.3%
30.7%
32.8%
31.9%
34.6%
40.6%
42.0%
43.7%
52.3%
56.8%
22
Depreciation and amortization
471.0
583.6
739.8
918.6
1,025.9
1,364.9
1,788.9
2,276.3
2,787.7
3,262.6
23
EBITDA
7,221.1
7,084.3
9,782.1
9,941.2
12,327.3
19,019.8
25,217.5
31,797.7
43,252.3
50,163.5
24
EBITDA margin
38.8%
33.5%
35.5%
35.2%
37.7%
43.7%
45.2%
47.0%
56.0%
60.8%
25
Interest and other, net
(44.6)
(44.6)
41.2
19.8
104.7
108.8
139.3
169.0
193.2
206.4
26
Income before income taxes
6,705.5
6,456.1
9,083.5
9,042.4
11,406.1
17,763.6
23,567.9
29,690.4
40,657.8
47,107.3
27
Income tax expense
(1,021.4)
(969.9)
(1,435.8)
(1,680.6)
(2,013.4)
(3,318.6)
(4,357.7)
(5,445.0)
(7,293.6)
(8,376.7)
28
Effective tax rate
15.2%
15.0%
15.8%
18.6%
17.7%
18.7%
18.5%
18.3%
17.9%
17.8%
29
Income after income taxes
5,684.1
5,486.2
7,647.7
7,361.8
9,392.7
14,445.1
19,210.2
24,245.4
33,364.3
38,730.6
30
Profit from equity method investments
199.1
138.0
191.3
209.8
216.7
282.9
362.3
439.3
502.4
536.6
31
Net income
5,893.2
5,624.2
7,839.0
7,571.6
9,609.4
14,728.0
19,572.5
24,684.7
33,866.7
39,267.2
Assumption editor

Every driver is editable and recalculates the whole model.

Formula tracing

Inspect the relationship behind any modelled cell.

Excel export

Download a workbook with live formulas and dependencies intact.

London skyline at dusk across the Thames
Vision 3

Agentic Equity Analyst,
designed for specialists.

Built for investors who need more than generic financial AI.